Supplementary Data
Since being published, Community College Finance has become the pre-eminent reference on funding Democracy's Colleges. While the philosophies and approaches outlined in the book endure overtime, the data do not.With respected to a second edition, we sell too many books to stop publishing it, but not enough for an updated version. This site was developed to serve as a supplemental source of data on the topics covered to keep it current.If you use this book in your course, or college, and would like the speakers to "zoom-in" we hope you will reach out to us. We welcome the opportunity to discuss this complex and critical topic with you.
Citation: Mullin, C. M. & Baime, D.S. (2025). Community College Finance: Supplementary Data Retrieved from CommunityCollegeFinance.org
Figure 1.1. The Number of Community Colleges, by Type and Source: 2011 to 2021
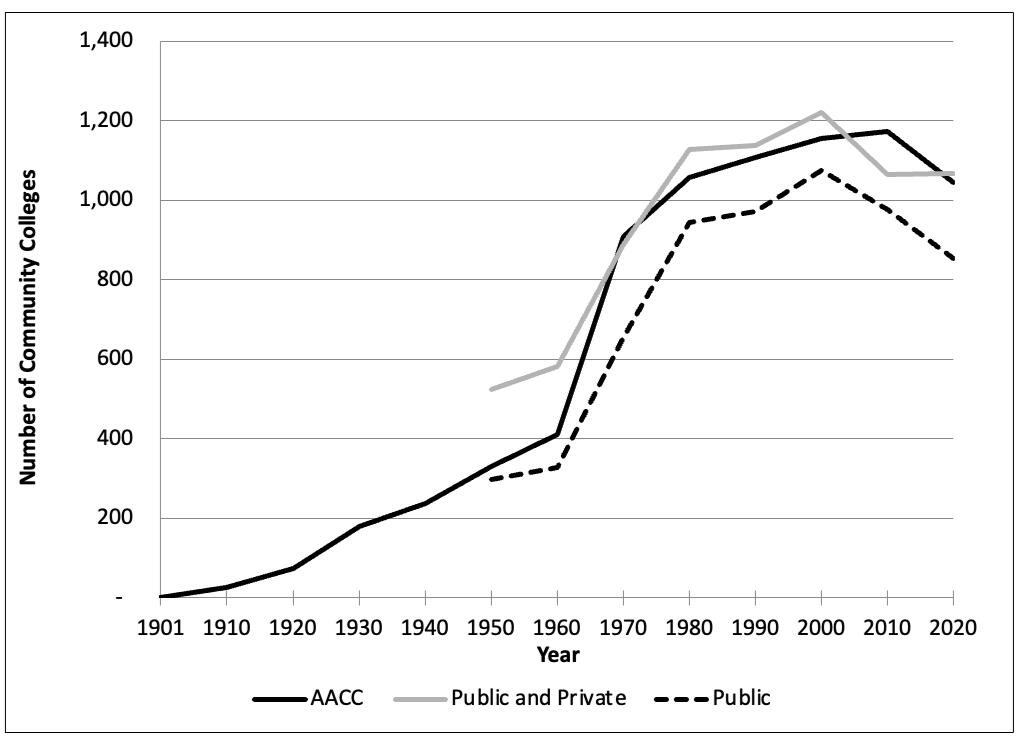
Figure 1.2. Enrollment Growth in Public Community Colleges Indexed to the first Year of the Decade: 2010s
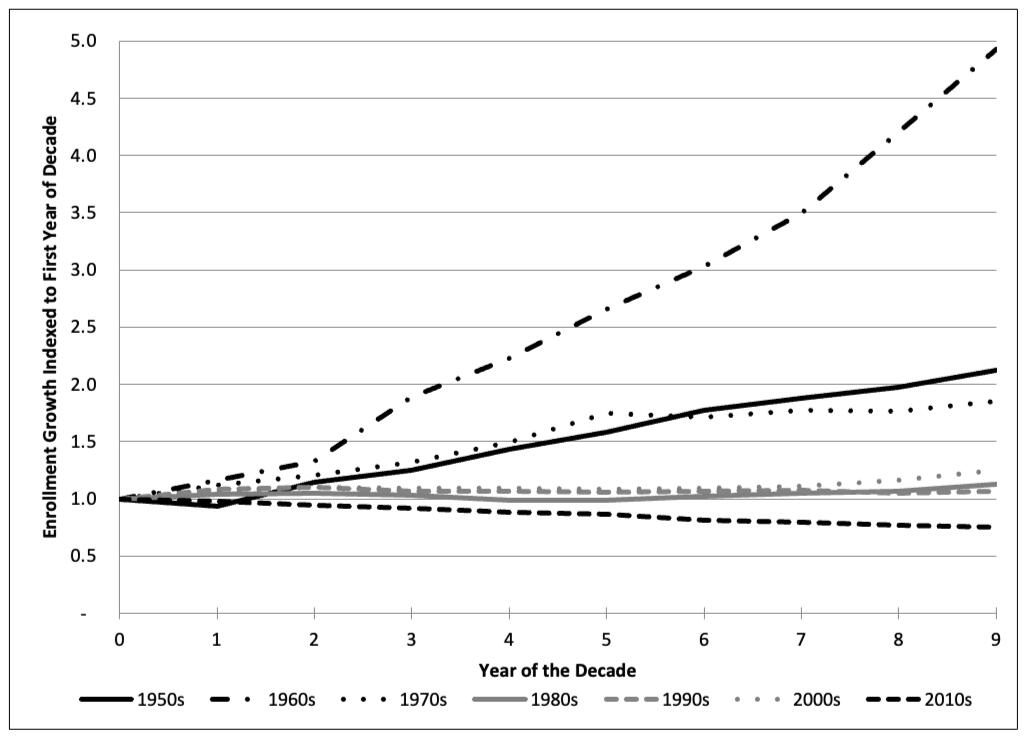
Figure 1.3. Fall Enrollment at Public Community Colleges, by Gender: 1960 to 2020
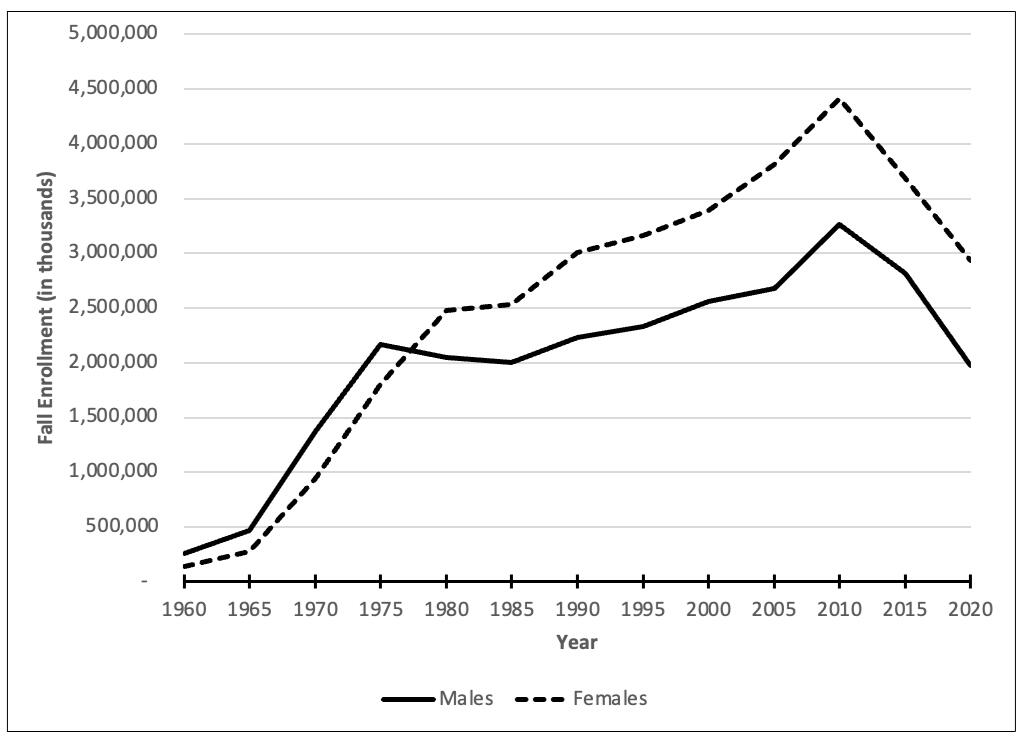
Figure 1.4. Annual Percent Change in Community College Enrollment and the National Unemployment Rate: 1965 to 2020
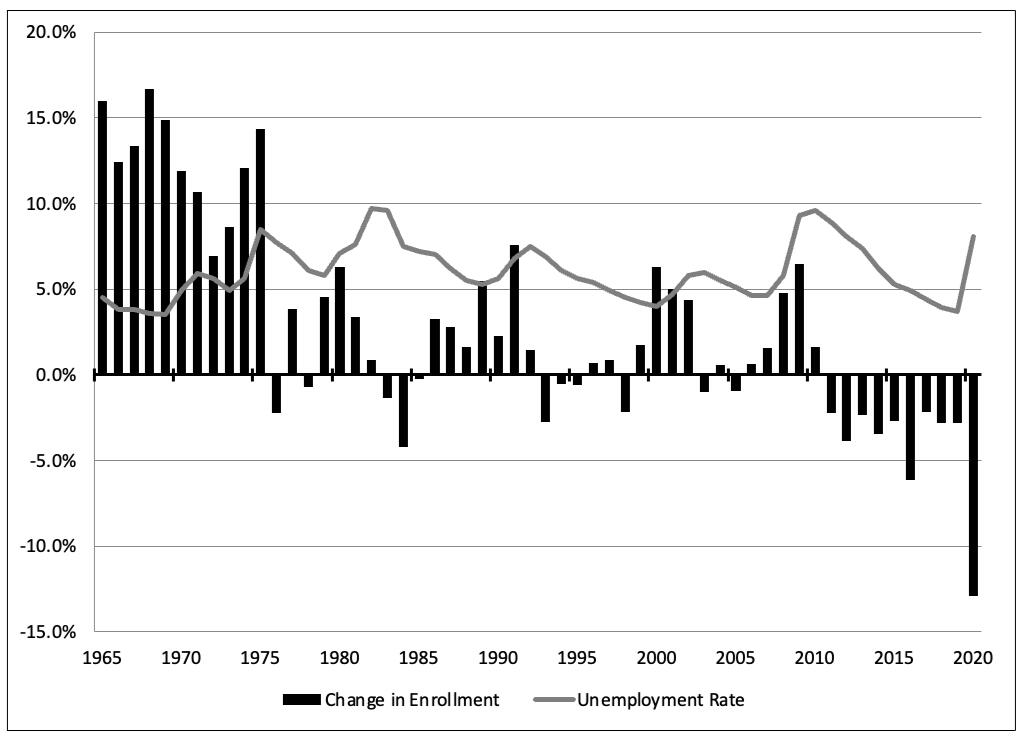
Figure 1.5. Distribution of State Expenditures for Health, Education, and Economic Affairs: 2013 to 2022
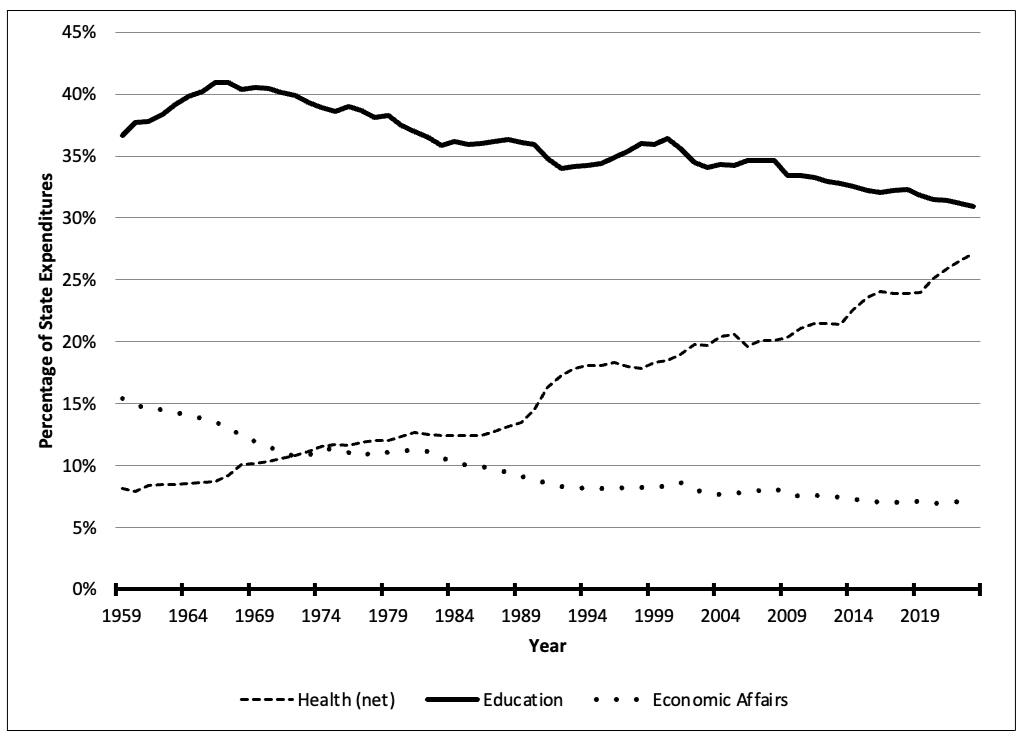
Table 1.1. Fall Term Enrollment at Community Colleges, by Race/Ethnicity: Select Years
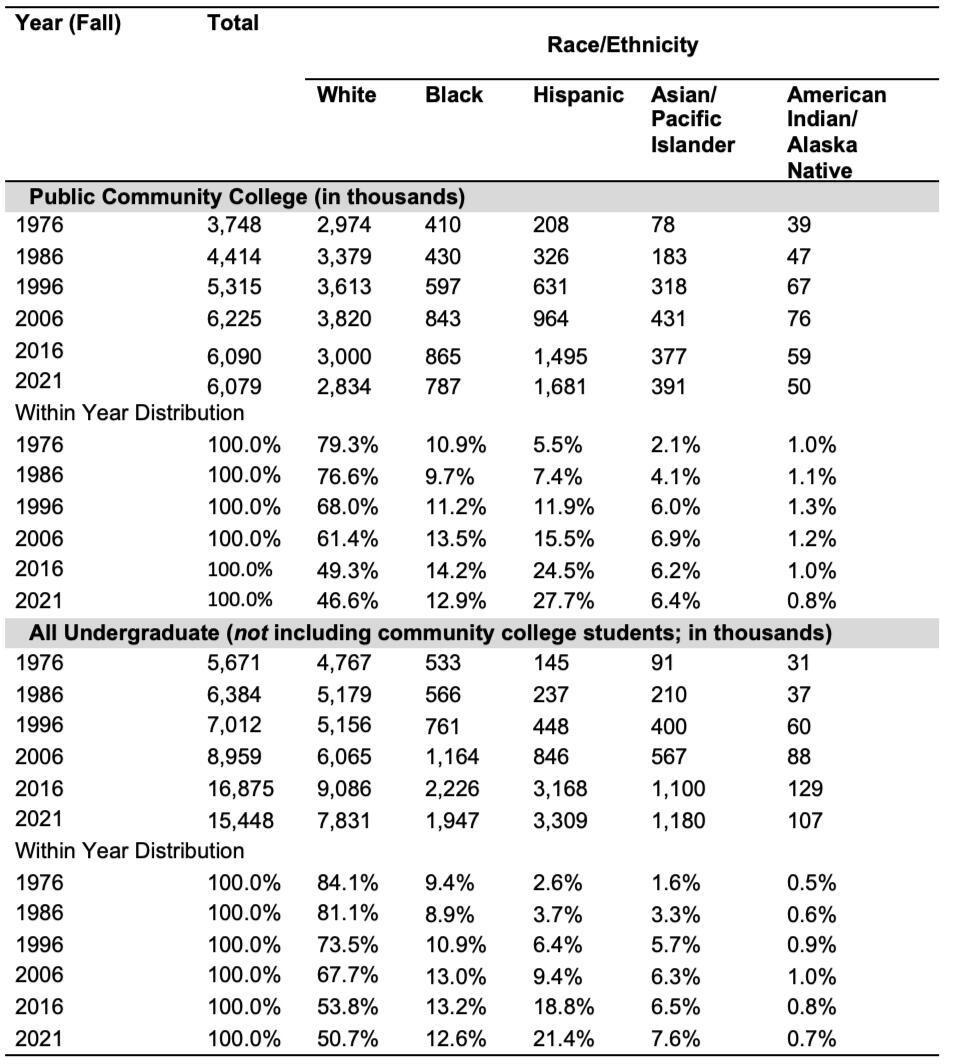
Note. An error for race/ethnicity of "All Undergraduates" in the original table is fixed here.
Figure 2.1. Distribution of Expenditures to Finance Higher Education: 2012 to 2023
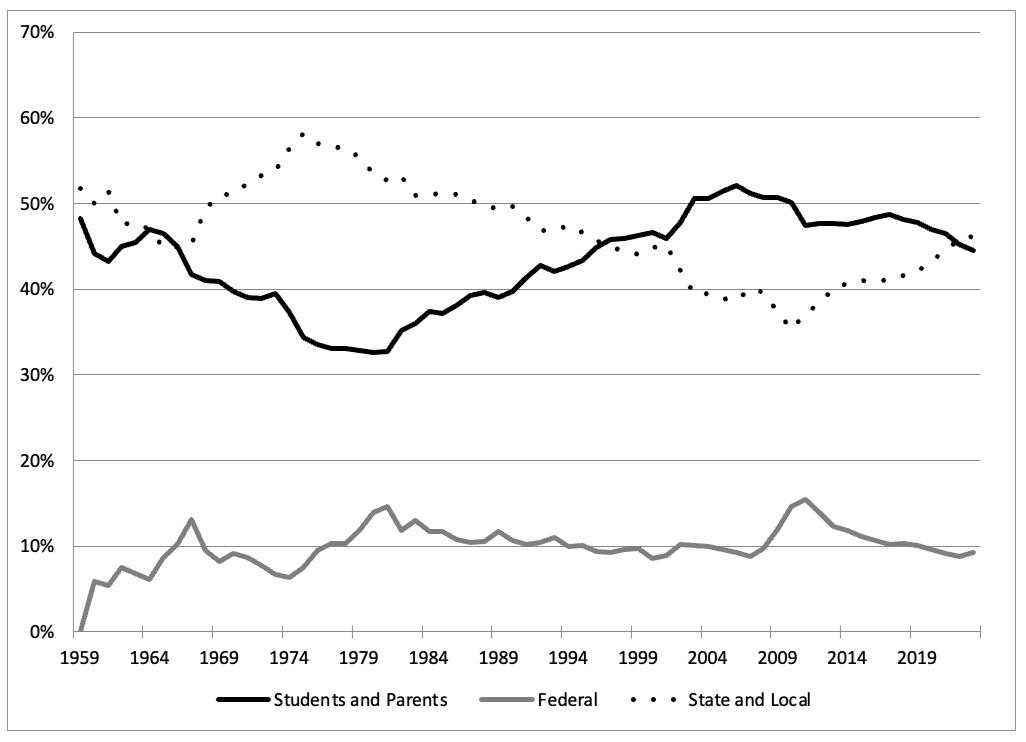
Figure 2.2. Percent of Community College Revenues in Virginia, by Source
Unable to update the figure at this time.
Figure 2.3. Percent of Operating Revenue for California Community Colleges, by Source.
Unable to update the figure at this time.
Figure 2.4. Percent of Operating Revenue for Illinois Community Colleges, by Source.
Unable to update the figure at this time.
Figure 3.1. Total Revenues per Student at Public Community Colleges and Four-Year Institutions Indexed to 2018-19
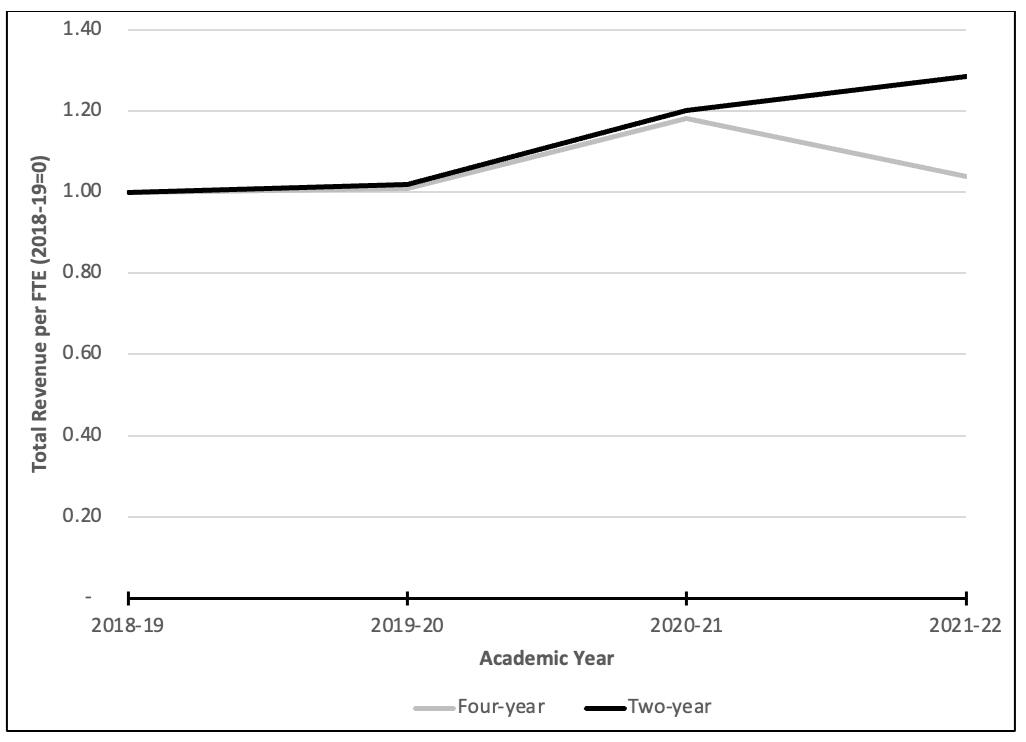
Table 3.1. Community College Revenues, by Category: 2021–2022
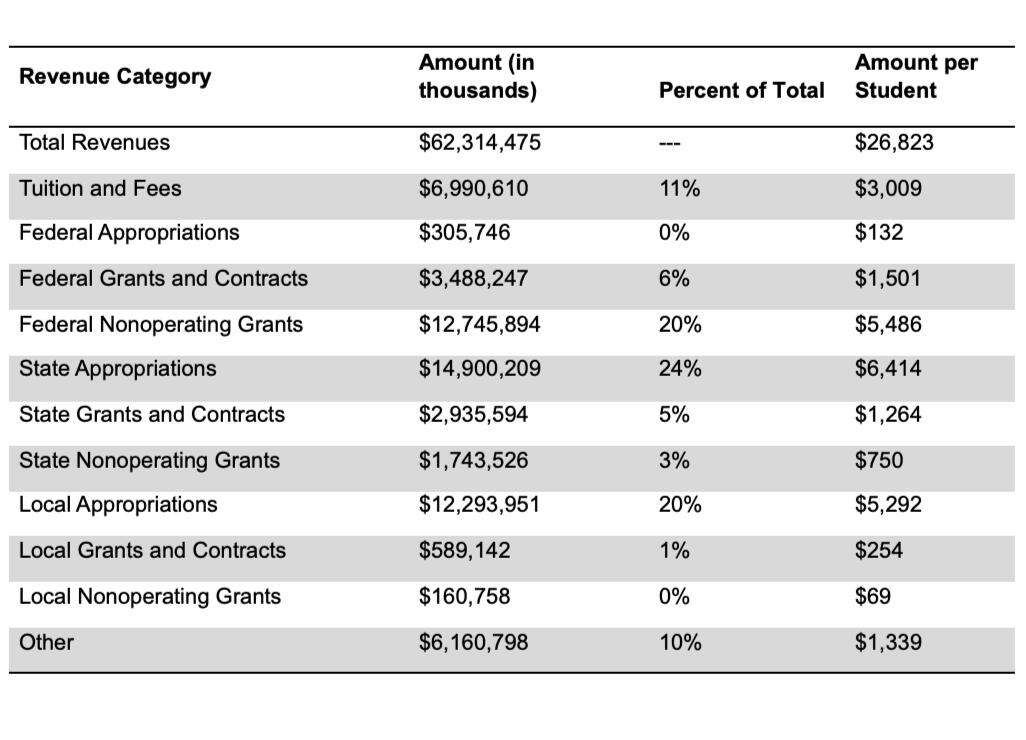
Figure 4.1. Trends in Inflation Adjusted Tuition and Fee Prices for Public Two-Year Institutions Published by the College Board and the National Center for Education Statistics: 1986-87 to 2022-2023
....
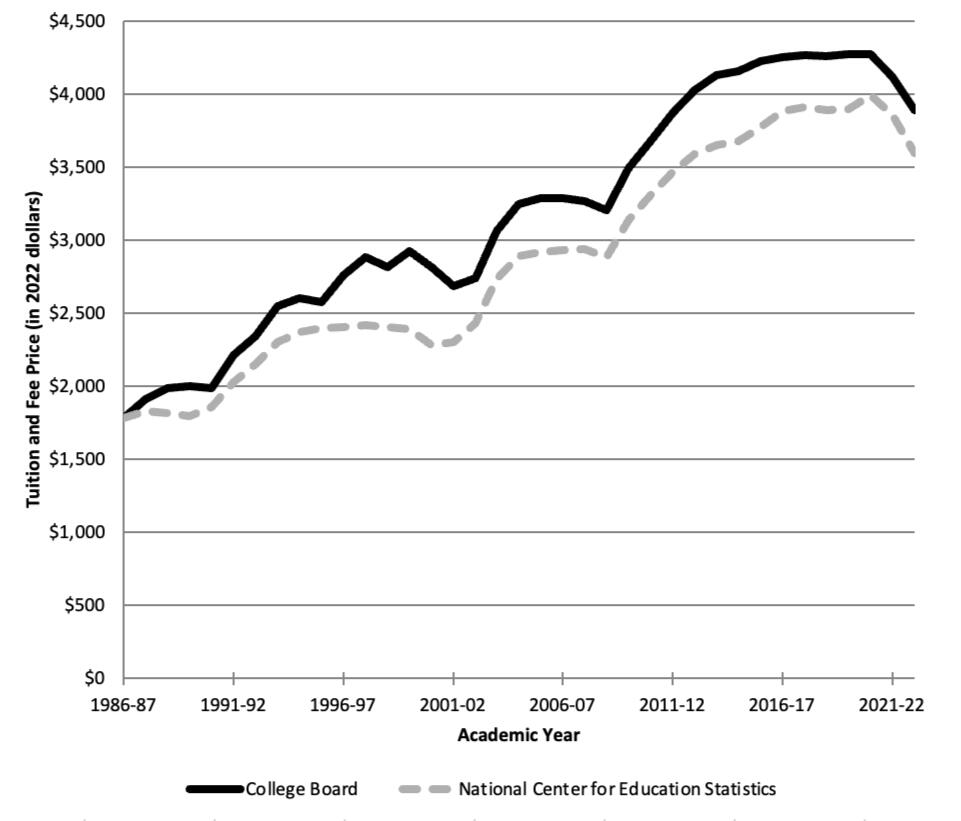
Figure 4.2. National Average Required Fees Amount: 2012–2013 to 2023-24
...
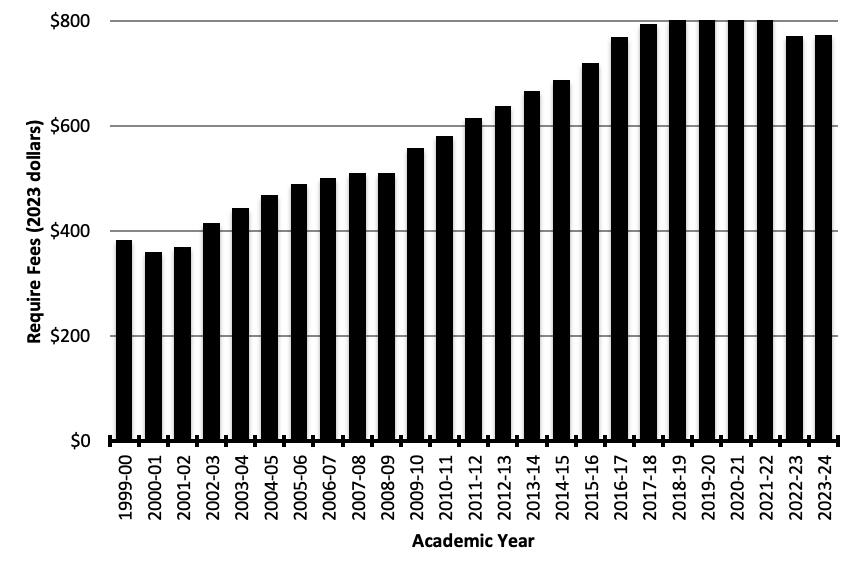
Figure 8.1. Comparing Changes in Two Measures of Educational Attainment
...
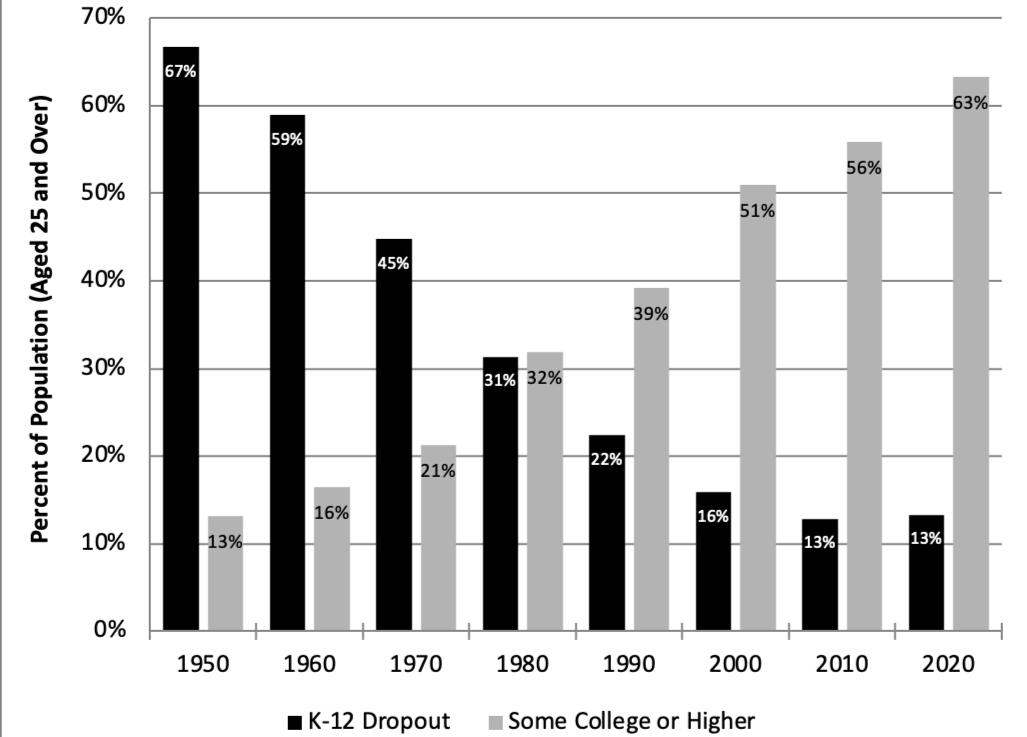
Figure 8.2. Educational Attainment Levels in Countries for 25- to 64-Year-Olds (Percentage of the Population), with Top Six Countries Ranked: 1991 to 2023
...
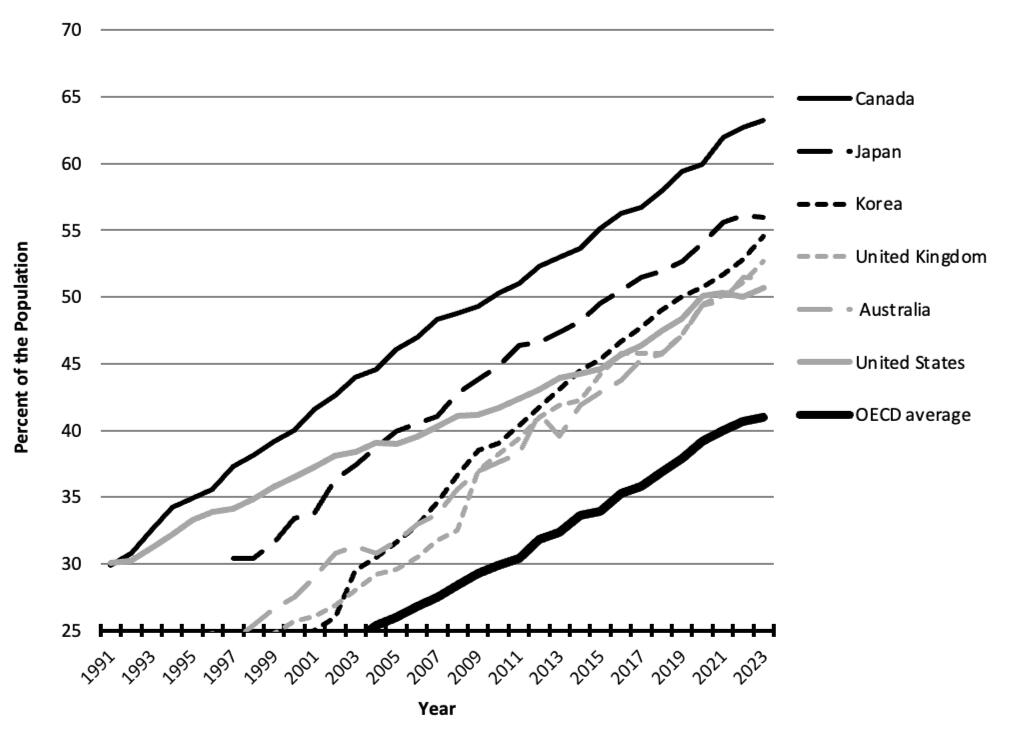
Figure 8.3. Six-Year Outcomes for Students Beginning at a Community College in Fall 2022
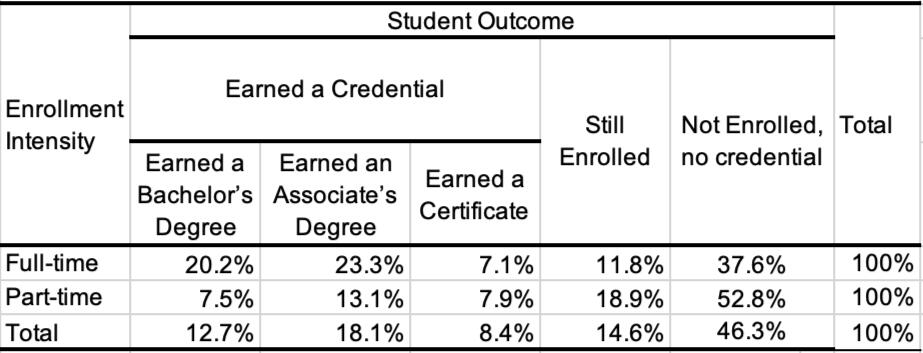
Figure 9.3. Freshman Class Enrollment Counts at 31 Private, Highly Selective Liberal Arts Colleges Constituting the Membership of the Consortium on Financing Higher Education (COFHE)
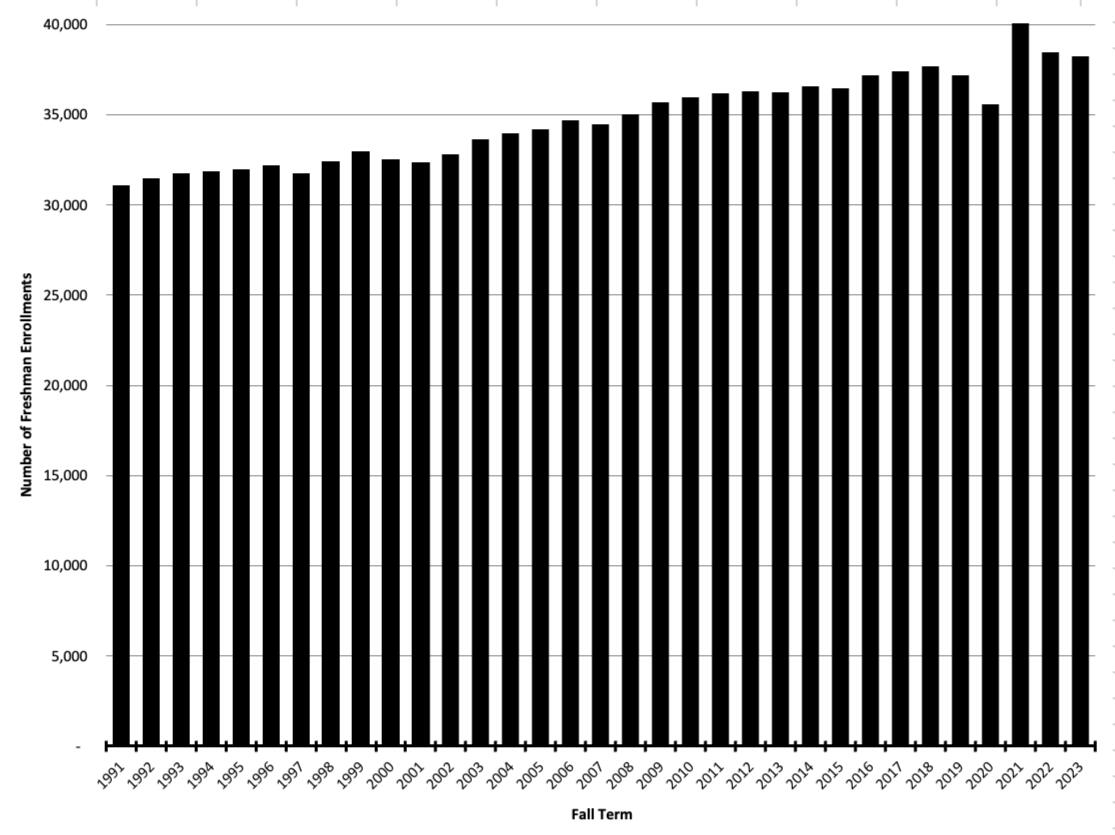
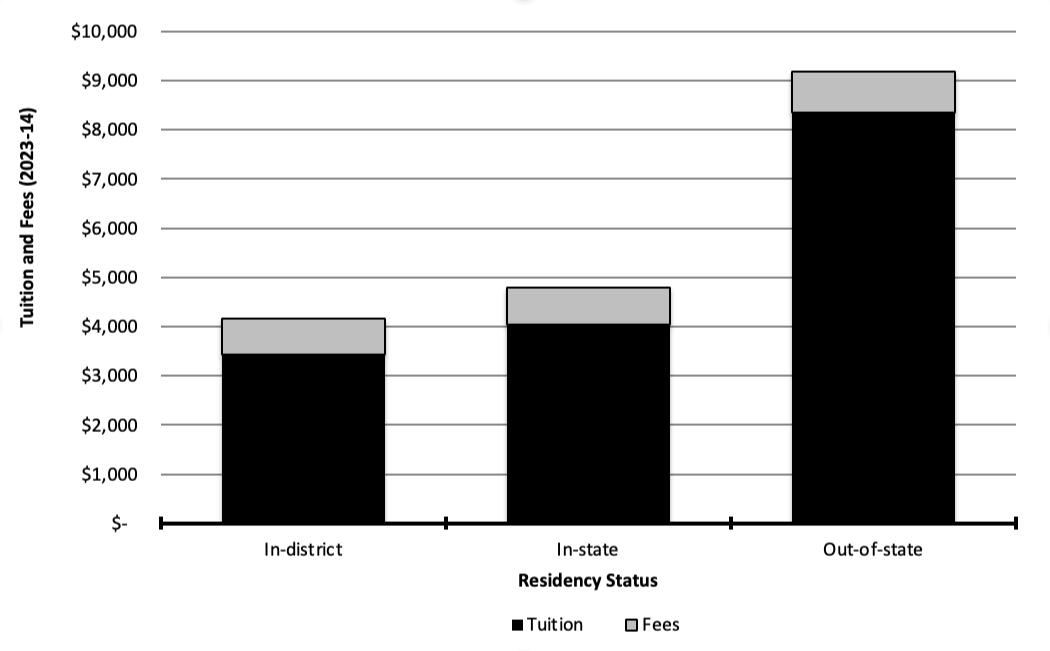
Figure 12.1. In-District, In-State, and Out-of-State Tuition and Fees
contact US
Questions, Comments, Requests
Thank you for visiting the site. We look forward to hearing from you.